Pandora
Designing with data to drive sales and insights
I had the privilege to freelance for Pandora as a visual information designer over a two year period. They brought me on to take their data—often complex and demographic-heavy—and turn it into something simple, clear and engaging for the public. I got to do everything from illustrations and infographics to charts and even longer book-style advertising pieces. Their color palette was fresh and the data itself was fascinating to work with. What I loved most about this work was how it sat right at the intersection of design and data storytelling. It was a creative challenge every time and I walked away from each project exploring that tension between data and design that I love so much.
Data Viz Designer
2018 - 2020
Create data-driven, infographic-style illustrations that attract subscribers.
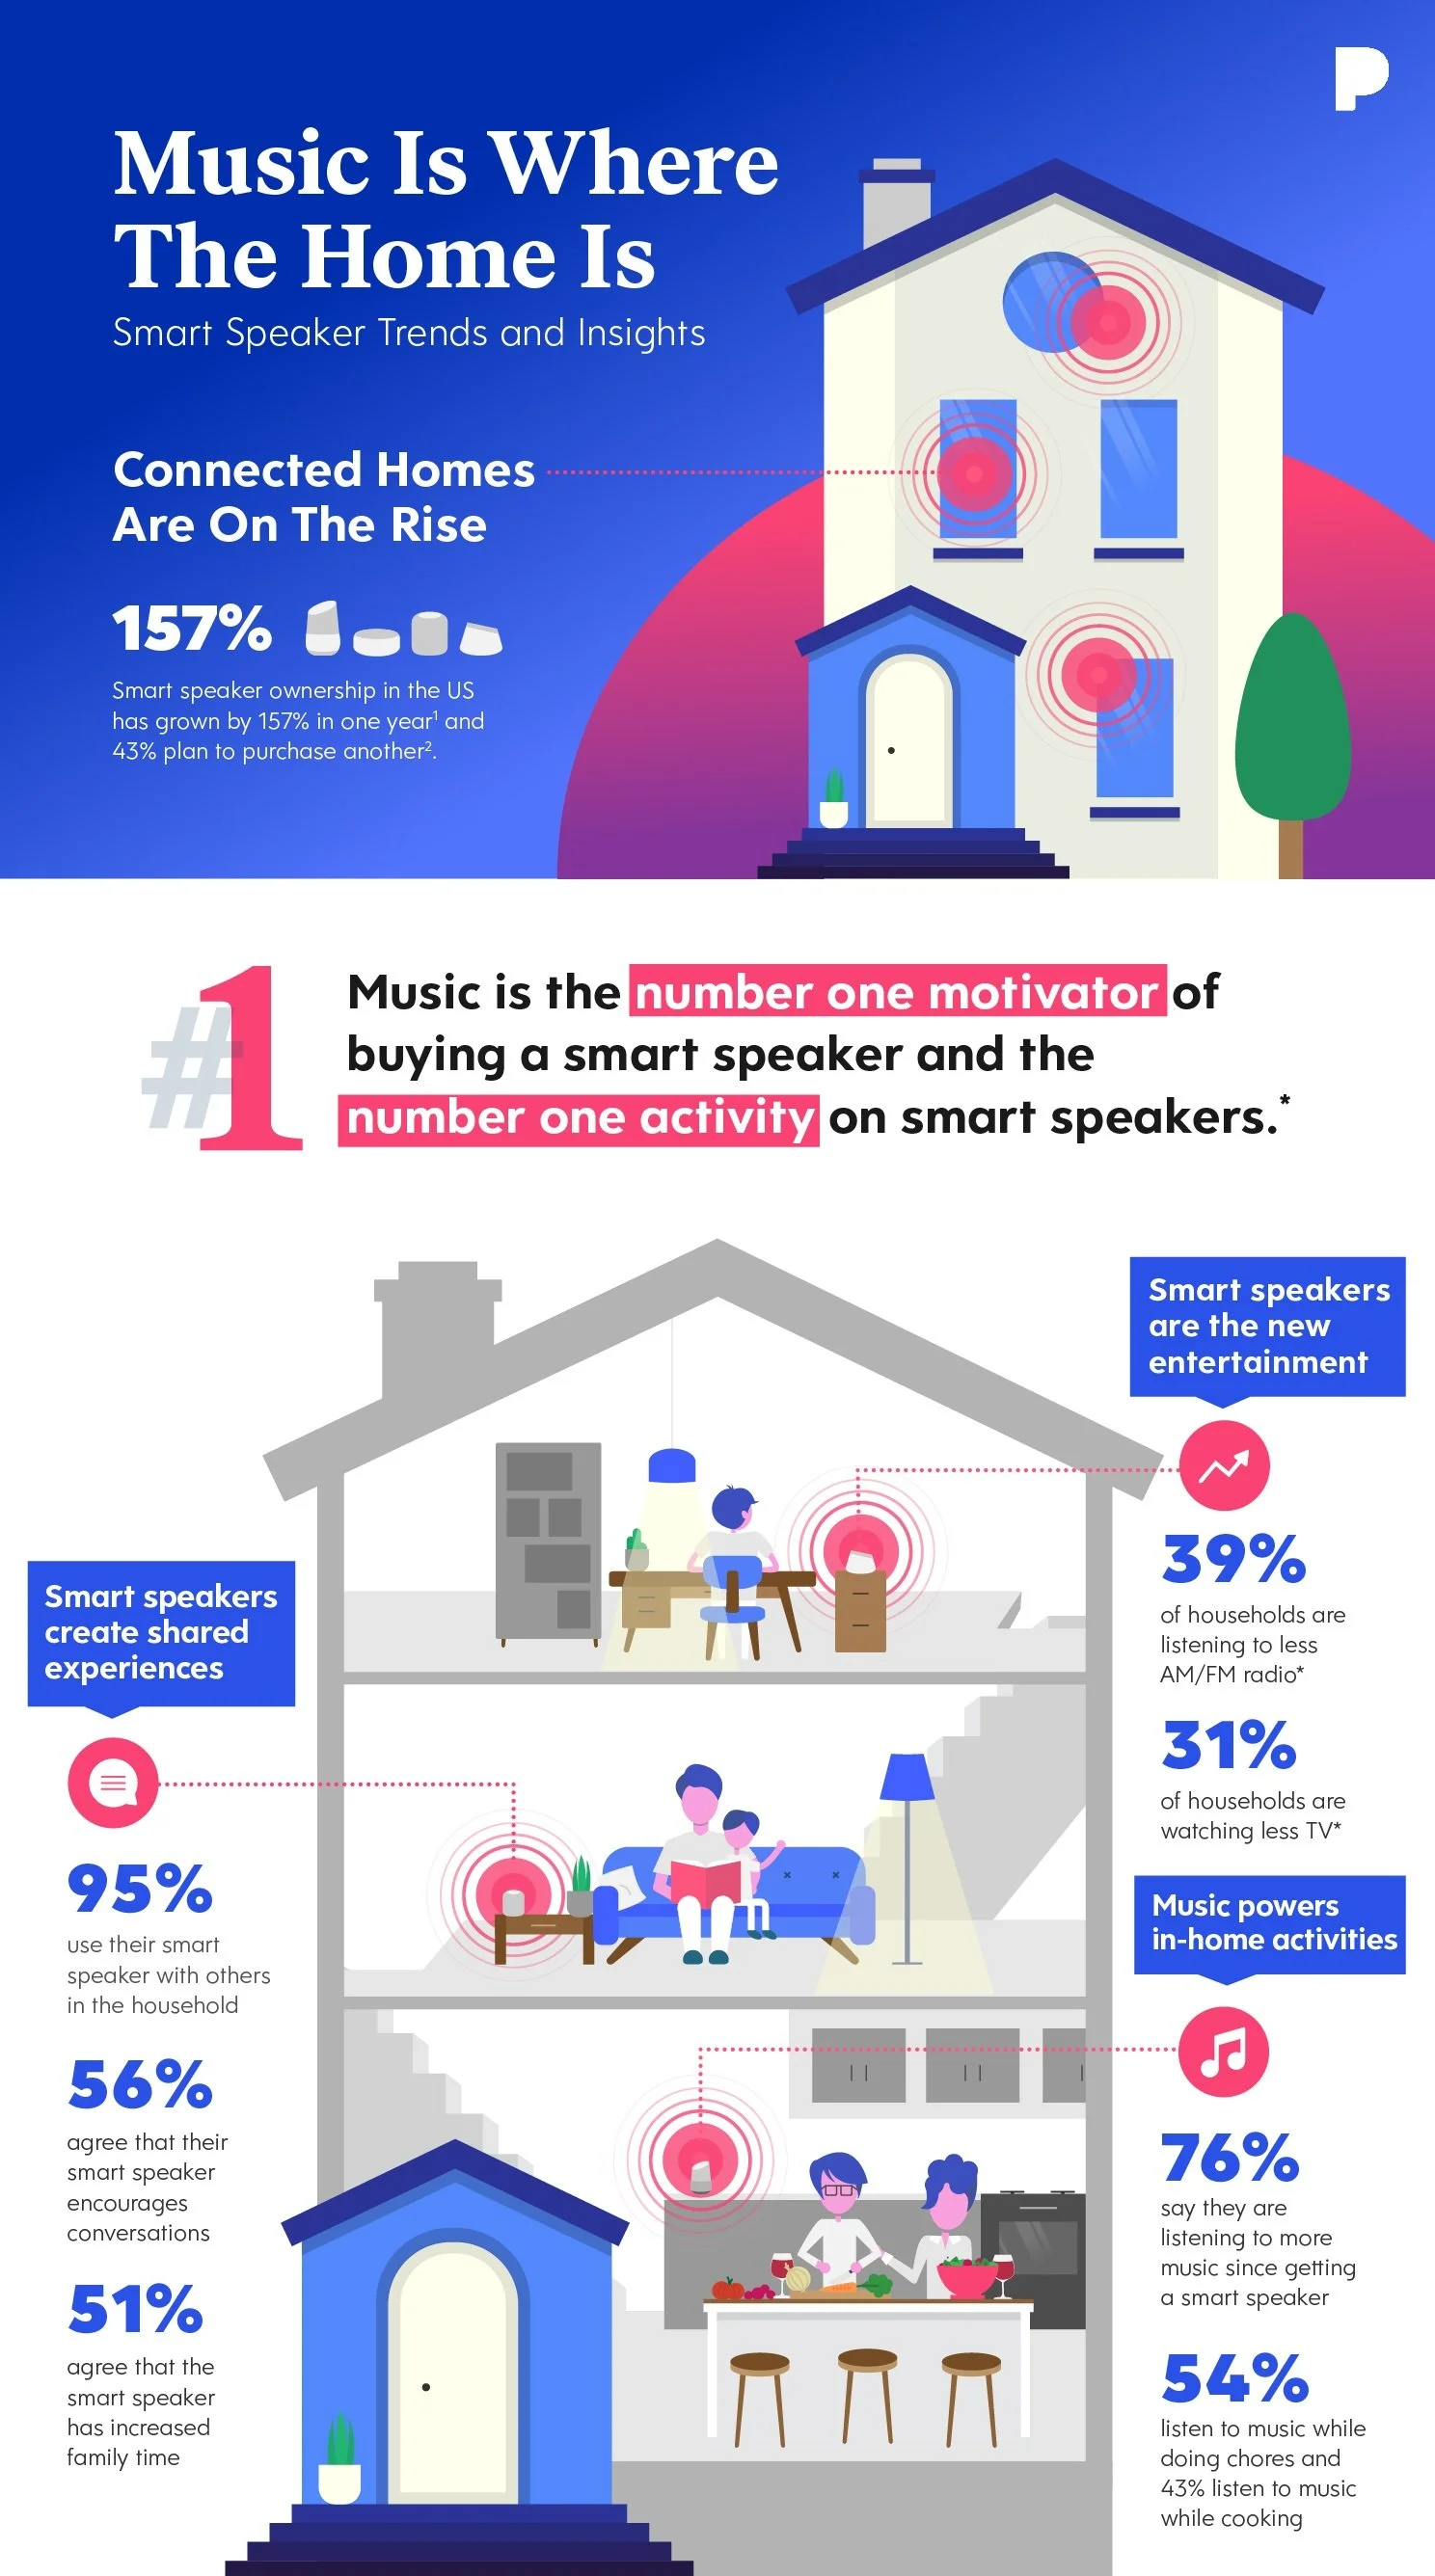
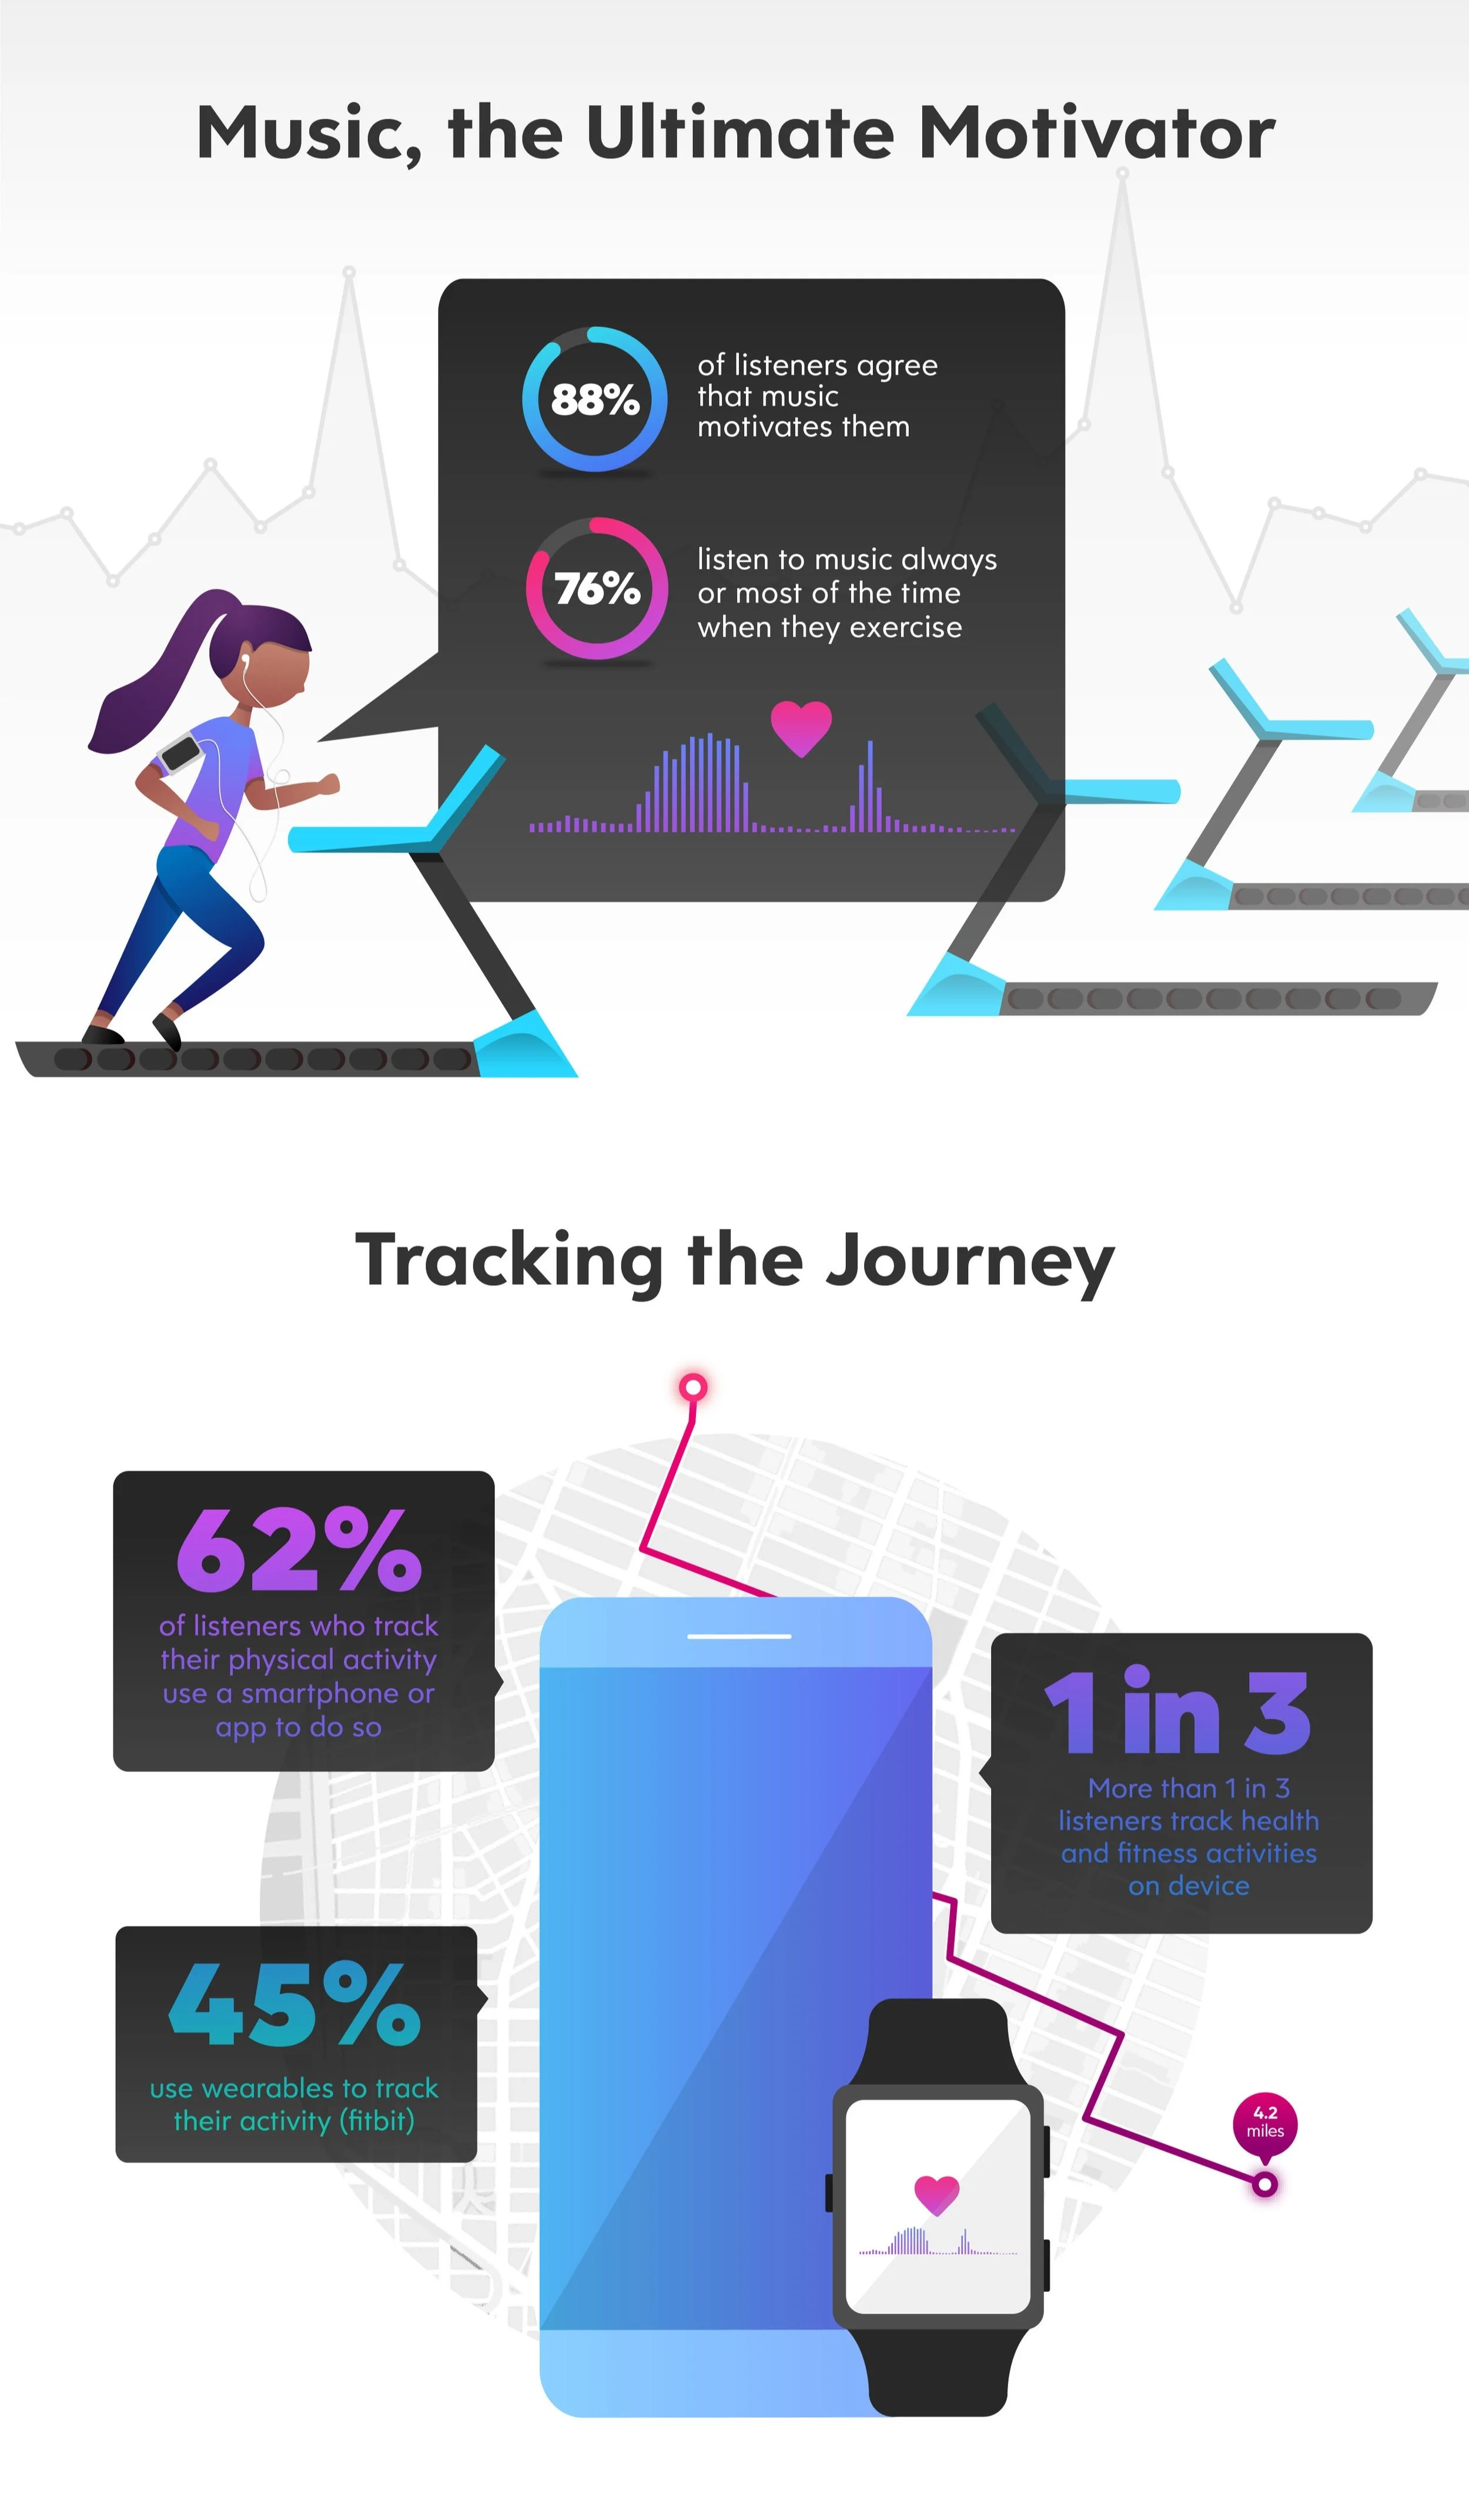
Infographics
Here are a few infographics we created over the years. I learned how to illustrate on the job - a skill I’m so thankful I picked up, even if I’d change alot about them now.
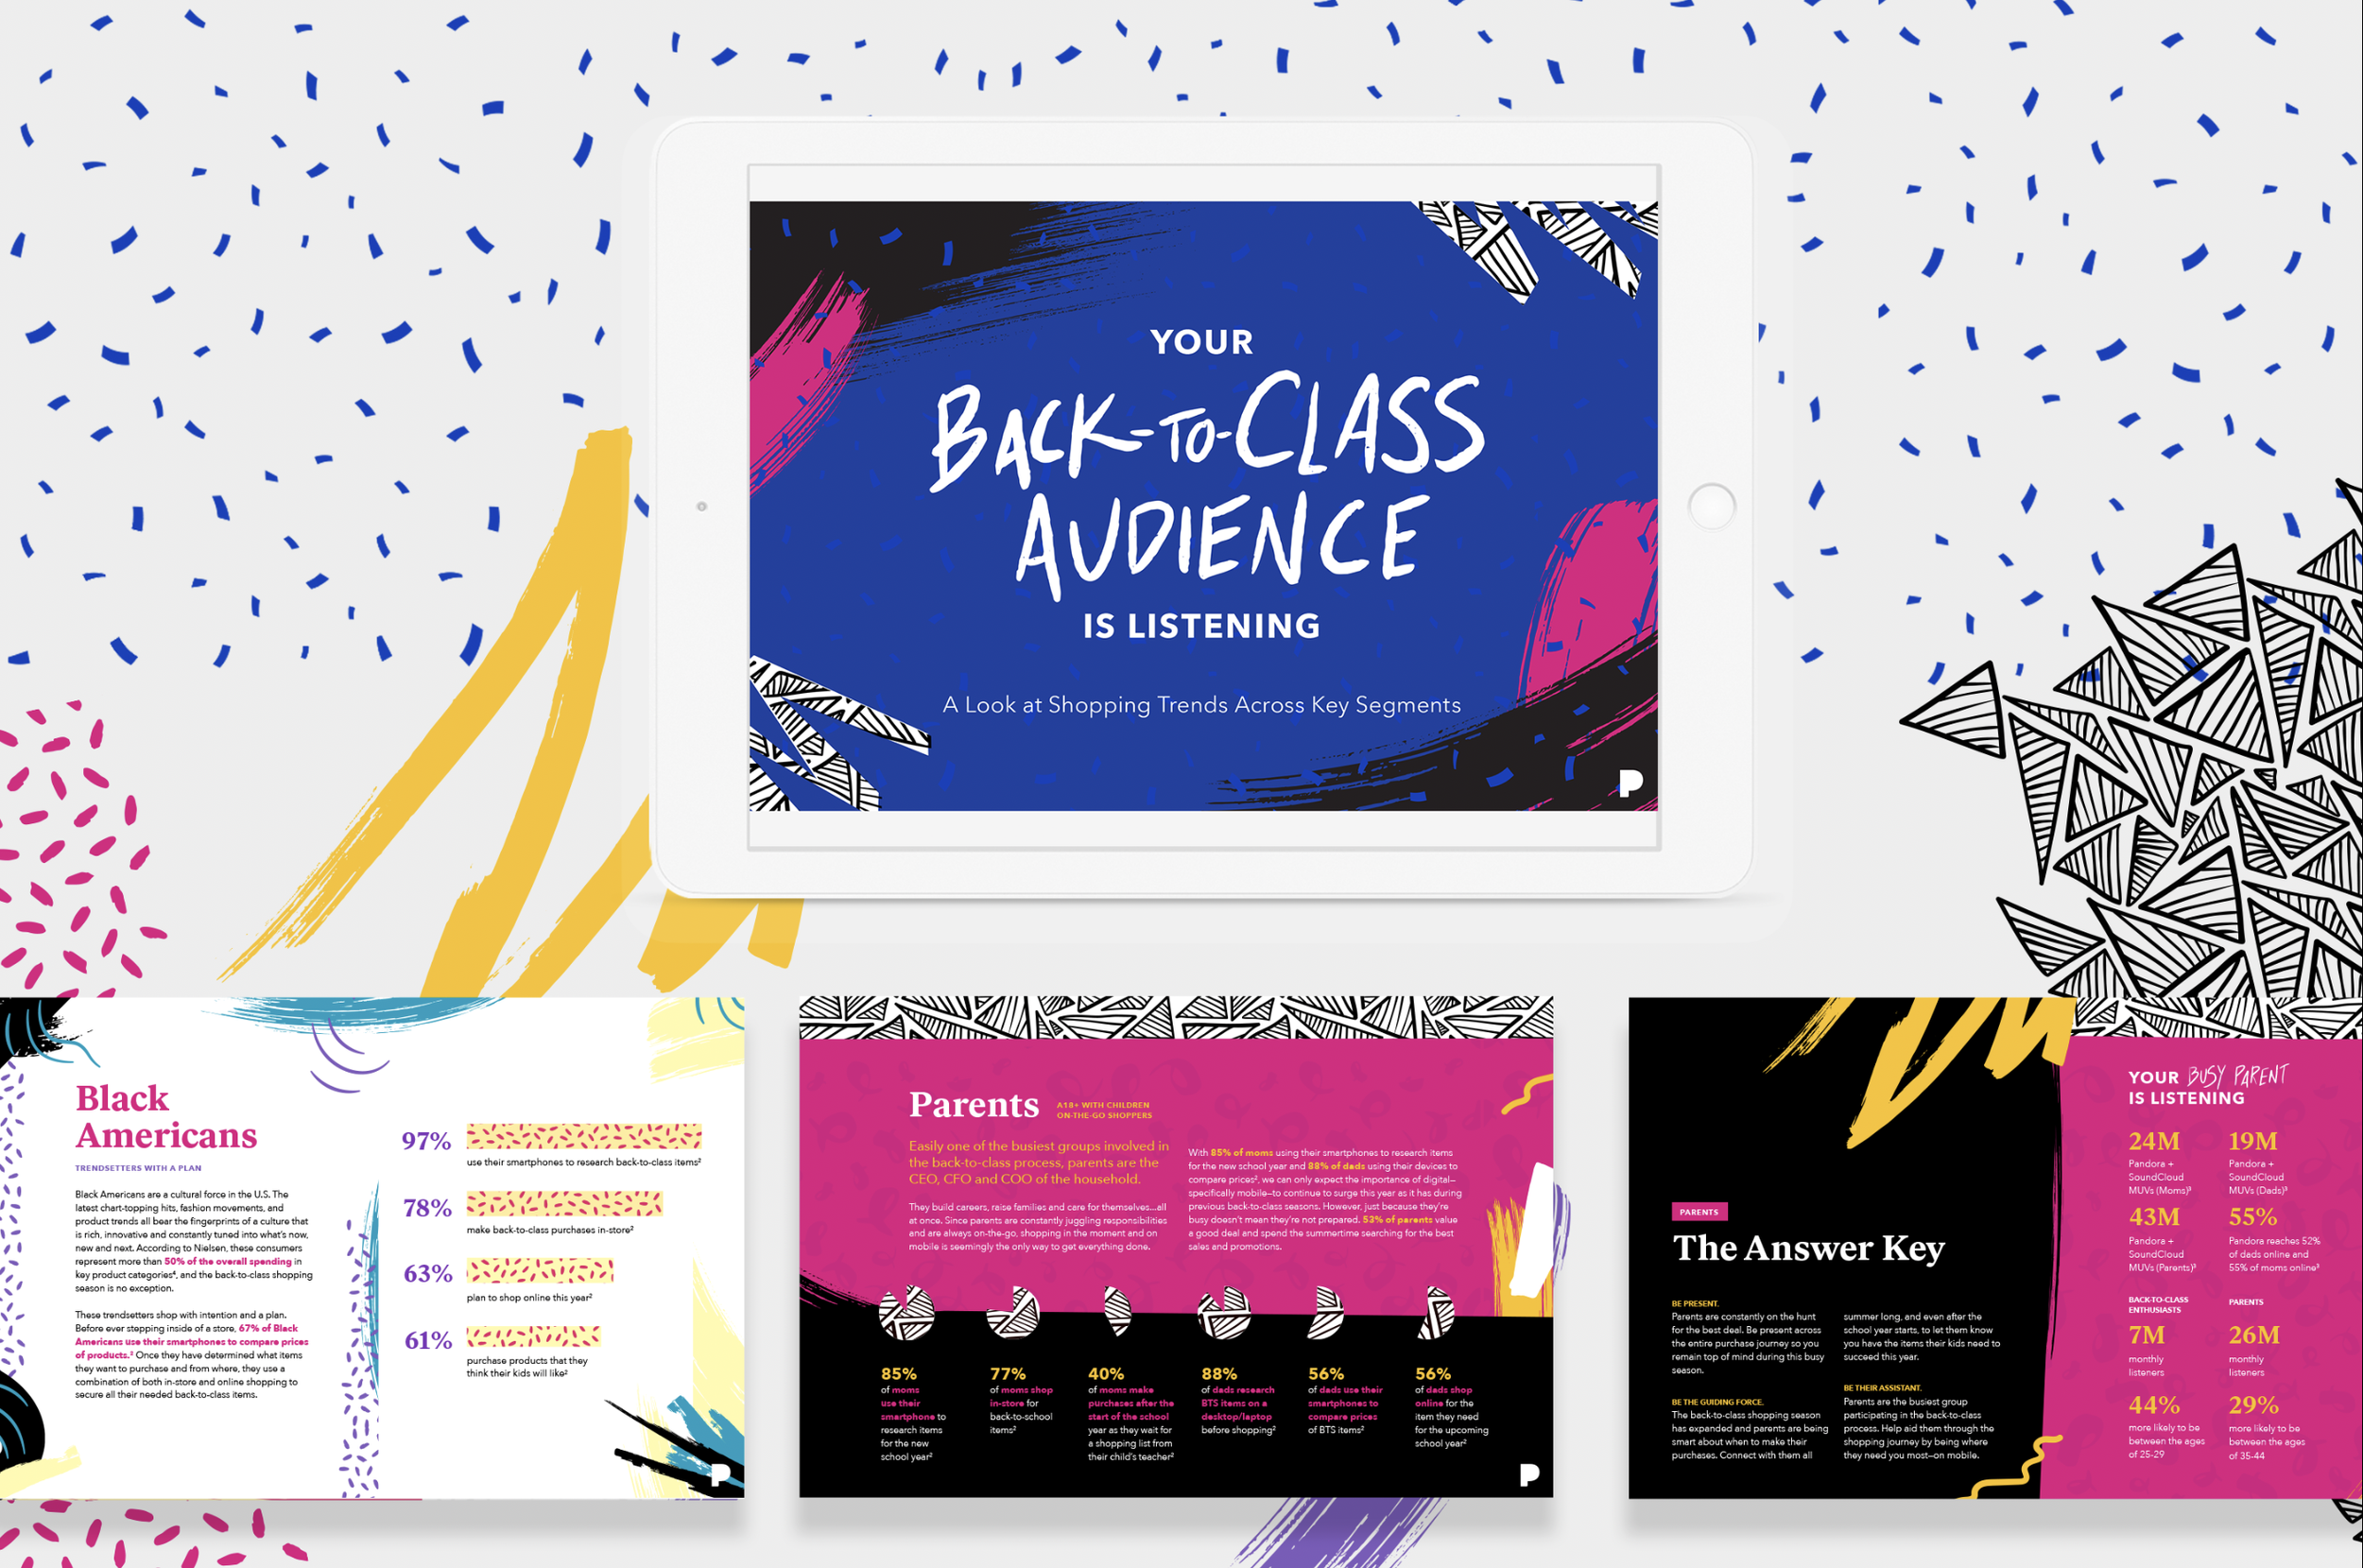
Three eBooks for Pandora
These are snippets from a few dynamic eBooks I created with Pandora for their Brands division. I was given styles, colors and textures along with content of each book. This was a very fun job because I used data viz storytelling skills to create these books that were behind a pay wall to increase their subscriber base.


